Learn “Make” by Examples
Table of contents
Makefiles
One of the things that might discourage someone from using Make is that existing Makefiles can look quite complex, and it might seem difficult to tailor one to your own needs. In this hands-on tutorial we will create a Makefile from scratch for a real data analysis project. The idea is to explain different features of Make by iterating through several versions of a Makefile for this project. Hopefully the experience that you gain from this tutorial allows you to create Makefiles for your own projects.
We will create a Makefile for a data analysis pipeline. The task is as
follows:
Task: Given some datasets, create a summary report (in pdf) that contains the histograms of these datasets.
(Of course this data task is very simple to focus on how to use Make.)
Throughout the tutorial code blocks that start with a dollar sign ($) are
intended to be typed in the terminal.
Setting up
We have created a basic repository for this task, that already contains everything that we need (except the Makefile of course!). To start, clone the base repository using git:
$ git clone https://github.com/alan-turing-institute/IntroToMake
This basic repository contains all the code that we’ll need in this tutorial, and should have this content:
.
├── data/
│   ├── input_file_1.csv
│   └── input_file_2.csv
├── LICENSE
├── output/
├── README.md
├── report/
│   └── report.tex
└── scripts/
    └── generate_histogram.py
data: directory with two datasets that we’re going to analyse
report: the input directory for the report
scripts: directory for the analysis script
output: output directory for the figures and the report
You’ll notice that there are two datasets in the data directory
(input_file_1.csv and input_file_2.csv) and that there is already a
basic Python script in scripts and a basic report LaTeX file in
report.
If you want to follow along, ensure that you have the matplotlib and
numpy packages installed:
$ pip install matplotlib numpy
You will also need a working version of pdflatex and, of course, make.
For installation instructions for Make, see
Installing Make.
Makefile no. 1 (The Basics)
Let’s create our first Makefile. In the terminal, move into the
IntroToMake repository that you just cloned:
$ cd IntroToMake
Using your favourite editor, create a file called Makefile with the
following contents:
# Makefile for analysis report

output/figure_1.png: data/input_file_1.csv scripts/generate_histogram.py
	python scripts/generate_histogram.py -i data/input_file_1.csv -o output/figure_1.png

output/figure_2.png: data/input_file_2.csv scripts/generate_histogram.py
	python scripts/generate_histogram.py -i data/input_file_2.csv -o output/figure_2.png

output/report.pdf: report/report.tex output/figure_1.png output/figure_2.png
	cd report/ && pdflatex report.tex && mv report.pdf ../output/report.pdf
The indentation in each of the recipes are tabs, Makefiles do not accept indentation with spaces.
You should now be able to type:
$ make output/report.pdf
If everything worked correctly, the two figures will be created and pdf report will be built.
Let’s go through the Makefile in a bit more detail. We have three rules, two
for the figures and one for the report. Let’s look at the rule for
output/figure_1.png first. This rule has the target
output/figure_1.png that has two prerequisites: data/input_file_1.csv
and scripts/generate_histogram.py. By giving the output file these
prerequisites it will be updated if either of these files changes. This is one
of the reasons why Make was created: to update output files when source files
change.
You’ll notice that the recipe line calls Python with the script name and uses
command line flags (-i and -o) to mark the input and output of the
script. This isn’t a requirement for using Make, but it makes it easy to see
which file is an input to the script and which is an output.
The rule for the PDF report is very similar, but it has three prerequisites (the LaTeX source and both figures). Notice that the recipe changes the working directory before calling LaTeX and also moves the generated PDF to the output directory. We’re doing this to keep the LaTeX intermediate files in the report directory. However, it’s important to distinguish the above rule from the following:
# don't do this
output/report.pdf: report/report.tex output/figure_1.png output/figure_2.png
	cd report/
	pdflatex report.tex
	mv report.pdf ../output/report.pdf
This rule places the three commands on separate lines. However, Make executes each line independently in a separate subshell, so changing the working directory in the first line has no effect on the second, and a failure in the second line won’t stop the third line from being executed. Therefore, we combine the three commands in a single recipe above.
This is what the dependency tree looks like for this Makefile:
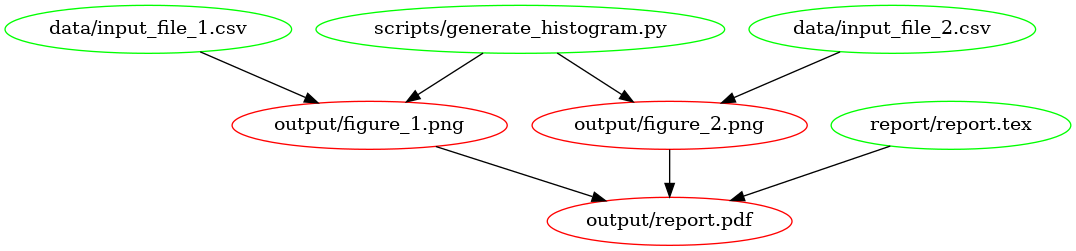 The
dependency graph for our first Makefile, created using
makefile2graph. Notice the
similarity to the figure in the introduction!
The
dependency graph for our first Makefile, created using
makefile2graph. Notice the
similarity to the figure in the introduction!
Makefile no. 2 (all and clean)
In our first Makefile we have the basic rules in place. We could stick with this if we wanted to, but there are a few improvements we can make:
We now have to explicitly call
make output/report.pdfif we want to make the report.We have no way to clean up and start fresh.
Let’s remedy this by adding two new targets: all and clean. In your
editor, change the Makefile contents to add the all and clean rules as
follows:
# Makefile for analysis report

all: output/report.pdf

output/figure_1.png: data/input_file_1.csv scripts/generate_histogram.py
	python scripts/generate_histogram.py -i data/input_file_1.csv -o output/figure_1.png

output/figure_2.png: data/input_file_2.csv scripts/generate_histogram.py
	python scripts/generate_histogram.py -i data/input_file_2.csv -o output/figure_2.png

output/report.pdf: report/report.tex output/figure_1.png output/figure_2.png
	cd report/ && pdflatex report.tex && mv report.pdf ../output/report.pdf

clean:
	rm -f output/report.pdf
	rm -f output/figure_*.png
Note that we’ve added the all target to the top of the file. We do this
because Make executes the first target when no explicit target is given. So
you can now type make on the command line and it would do the same as
make all. Also, note that we’ve only added the report as the prerequisite
of all because that’s our desired output and the other rules help to build
that output. If you have multiple outputs, you could add these as further
prerequisites to the all target. Calling the main target all is a
convention of Makefiles that many people follow.
The clean rule is typically at the bottom, but that’s more style than
requirement. Note that we use the -f flag to rm to make sure it
doesn’t complain when there is no file to remove.
You can try out the new Makefile by running:
$ make clean
$ make
Make should remove the output and intermediate files after the first command, and generate them again after the second.
Makefile no. 3 (Phony Targets)
Typically, all and clean are defined as so-called Phony
Targets.
These are targets that don’t actually create an output file. Such targets will
always be run if they come up in a dependency, but will no longer be run if a
directory/file is ever created that is called all or clean. We
therefore add a line at the top of the Makefile to define these two as phony
targets:
# Makefile for analysis report

.PHONY: all clean

all: output/report.pdf

output/figure_1.png: data/input_file_1.csv scripts/generate_histogram.py
	python scripts/generate_histogram.py -i data/input_file_1.csv -o output/figure_1.png

output/figure_2.png: data/input_file_2.csv scripts/generate_histogram.py
	python scripts/generate_histogram.py -i data/input_file_2.csv -o output/figure_2.png

output/report.pdf: report/report.tex output/figure_1.png output/figure_2.png
	cd report/ && pdflatex report.tex && mv report.pdf ../output/report.pdf

clean:
	rm -f output/report.pdf
	rm -f output/figure_*.pdf
Phony targets are also useful when you want to use Make recursively. In that
case you would specify the subdirectories as phony targets. You can read more
about phony targets in the
documentation,
but for now it’s enough to know that all and clean are typically
declared as phony.
Sidenote: another target that’s typically phony is test, in case you have a directory of tests called test and want to have a target to run them that’s also called test.
Makefile no. 4 (Automatic Variables and Pattern Rules)
There’s nothing wrong with the Makefile we have now, but it’s somewhat verbose because we’ve declared all the targets explicitly using separate rules. We can simplify this by using Automatic Variables and Pattern Rules.
Automatic Variables.
With automatic variables we can use the names of the prerequisites and targets in the recipe. Here’s how we would do that for the figure rules:
# Makefile for analysis report

.PHONY: all clean

all: output/report.pdf

output/figure_1.png: data/input_file_1.csv scripts/generate_histogram.py
	python scripts/generate_histogram.py -i $< -o $@

output/figure_2.png: data/input_file_2.csv scripts/generate_histogram.py
	python scripts/generate_histogram.py -i $< -o $@

output/report.pdf: report/report.tex output/figure_1.png output/figure_2.png
	cd report/ && pdflatex report.tex && mv report.pdf ../output/report.pdf

clean:
	rm -f output/report.pdf
	rm -f output/figure_*.pdf
We’ve replaced the input and output filenames in the recipes respectively by
$<, which denotes the first prerequisite and $@ which denotes the
target. You can remember $< because it’s like an arrow that points to
the beginning (first prerequisite), and you can remember $@ (dollar
at) as the target you’re aiming
at.
There are more automatic variables that you could use, see the documentation.
Pattern Rules
Notice that the recipes for the figures have become
identical! Because we don’t like to repeat ourselves, we can combine the two
rules into a single rule by using pattern rules. Pattern rules allow you to
use the % symbol as a wildcard and combine the two rules into one:
# Makefile for analysis report

.PHONY: all clean

all: output/report.pdf

output/figure_%.png: data/input_file_%.csv scripts/generate_histogram.py
	python scripts/generate_histogram.py -i $< -o $@

output/report.pdf: report/report.tex output/figure_1.png output/figure_2.png
	cd report/ && pdflatex report.tex && mv report.pdf ../output/report.pdf

clean:
	rm -f output/report.pdf
	rm -f output/figure_*.pdf
The % symbol is now a wildcard that (in our case) takes the value 1 or
2 based on the input files in the data directory. You can check that
everything still works by running make clean followed by make.
An advantage of this is that if you now want to add another dataset, say
input_file_3, then you would only need to add that to the rule for the
report!
Makefile no. 5 (Wildcards and Path Substitution)
When Makefiles get more complex, you may want to use more advanced features such as building outputs for all the files in an input directory. While pattern rules will get you a long way, Make also has features for wildcards and string or path manipulation for when pattern rules are insufficient.
While previously our input files were numbered, we’ll now switch to a scenario
where they have more meaningful names. Let’s switch over to the big_data
branch:
$ git stash                     # stash the state of your working directory
$ git checkout big_data         # checkout the big_data branch
The directory structure now looks like this:
├── data/
│   ├── action.csv
│   ├── ...
│   ├── input_file_1.csv
│   ├── input_file_2.csv
│   ├── ...
│   └── western.csv
├── LICENSE
├── output/
├── README.md
├── report/
│   └── report.tex
└── scripts/
    └── generate_histogram.py
As you can see, the data directory now contains additional input files that are named more meaningfully (the data are IMBD movie ratings by genre). Also, the report.tex file has been updated to work with the expected figures.
We’ll adapt our Makefile to create a figure in the output directory called
histogram_{genre}.png for each {genre}.csv file, while excluding the
input_file_{N}.csv files.
Sidenote: if we were to remove the
input_file_{N}.csvfiles, pattern rules would be sufficient here. This highlights that sometimes your directory structure and Makefile should be developed hand in hand.
Before changing the Makefile, run
$ make clean
to remove the output files.
We’ll show the full Makefile first, and then describe the different lines in more detail. The complete file is:
# Makefile for analysis report
#

ALL_CSV = $(wildcard data/*.csv)
INPUT_CSV = $(wildcard data/input_file_*.csv)
DATA = $(filter-out $(INPUT_CSV),$(ALL_CSV))
FIGURES = $(patsubst data/%.csv,output/figure_%.png,$(DATA))

.PHONY: all clean

all: output/report.pdf

$(FIGURES): output/figure_%.png: data/%.csv scripts/generate_histogram.py
	python scripts/generate_histogram.py -i $< -o $@

output/report.pdf: report/report.tex $(FIGURES)
	cd report/ && pdflatex report.tex && mv report.pdf ../$@

clean:
	rm -f output/report.pdf
	rm -f $(FIGURES)
First, we use the wildcard function to create a variable that lists all
the CSV files in the data directory and one that lists only the old
input_file_{N}.csv files:
ALL_CSV = $(wildcard data/*.csv)
INPUT_CSV = $(wildcard data/input_file_*.csv)
A code convention for Makefiles is to use all capitals for variable names and define them at the top of the file.
Next, we create a variable to list only the data files that we’re interested
in by filtering out the INPUT_CSV from ALL_CSV:
DATA = $(filter-out $(INPUT_CSV),$(ALL_CSV))
This line uses the
filter-out
function to remove items in the INPUT_CSV variable from the ALL_CSV
variable. Note that we use both the $( ... ) syntax for functions and
variables. Finally, we’ll use the DATA variable to create a FIGURES
variable with the desired output:
FIGURES = $(patsubst data/%.csv,output/figure_%.png,$(DATA))
Here we’ve used the
patsubst
function to transform the input in the DATA variable (that follows the
data/{genre}.csv pattern) to the desired output filenames (using the
output/figure_{genre}.png pattern). Notice that the % character marks
the part of the filename that will be the same in both the input and output.
Now we use these variables for the figure generation rule as follows:
$(FIGURES): output/figure_%.png: data/%.csv scripts/generate_histogram.py
	python scripts/generate_histogram.py -i $< -o $@
This rule again applies a pattern: it takes a list of targets ($(FIGURES))
that all follow a given pattern (output/figure_%.png) and based on that
creates a prerequisite (data/%.csv). Such a pattern rule is slightly
different from the one we saw before because it uses two : symbols. It is
called a static pattern
rule.
Of course we have to update the report.pdf rule as well:
output/report.pdf: report/report.tex $(FIGURES)
	cd report/ && pdflatex report.tex && mv report.pdf ../$@
and the clean rule:
clean:
	rm -f output/report.pdf
	rm -f $(FIGURES)
If you run this Makefile, it will need to build 28 figures. You may want to
use the -j flag to make to build these targets in parallel!
$ make -j 4
The ability to build targets in parallel is quite useful when your project has many dependencies!
The resulting PDF file should now look like this:
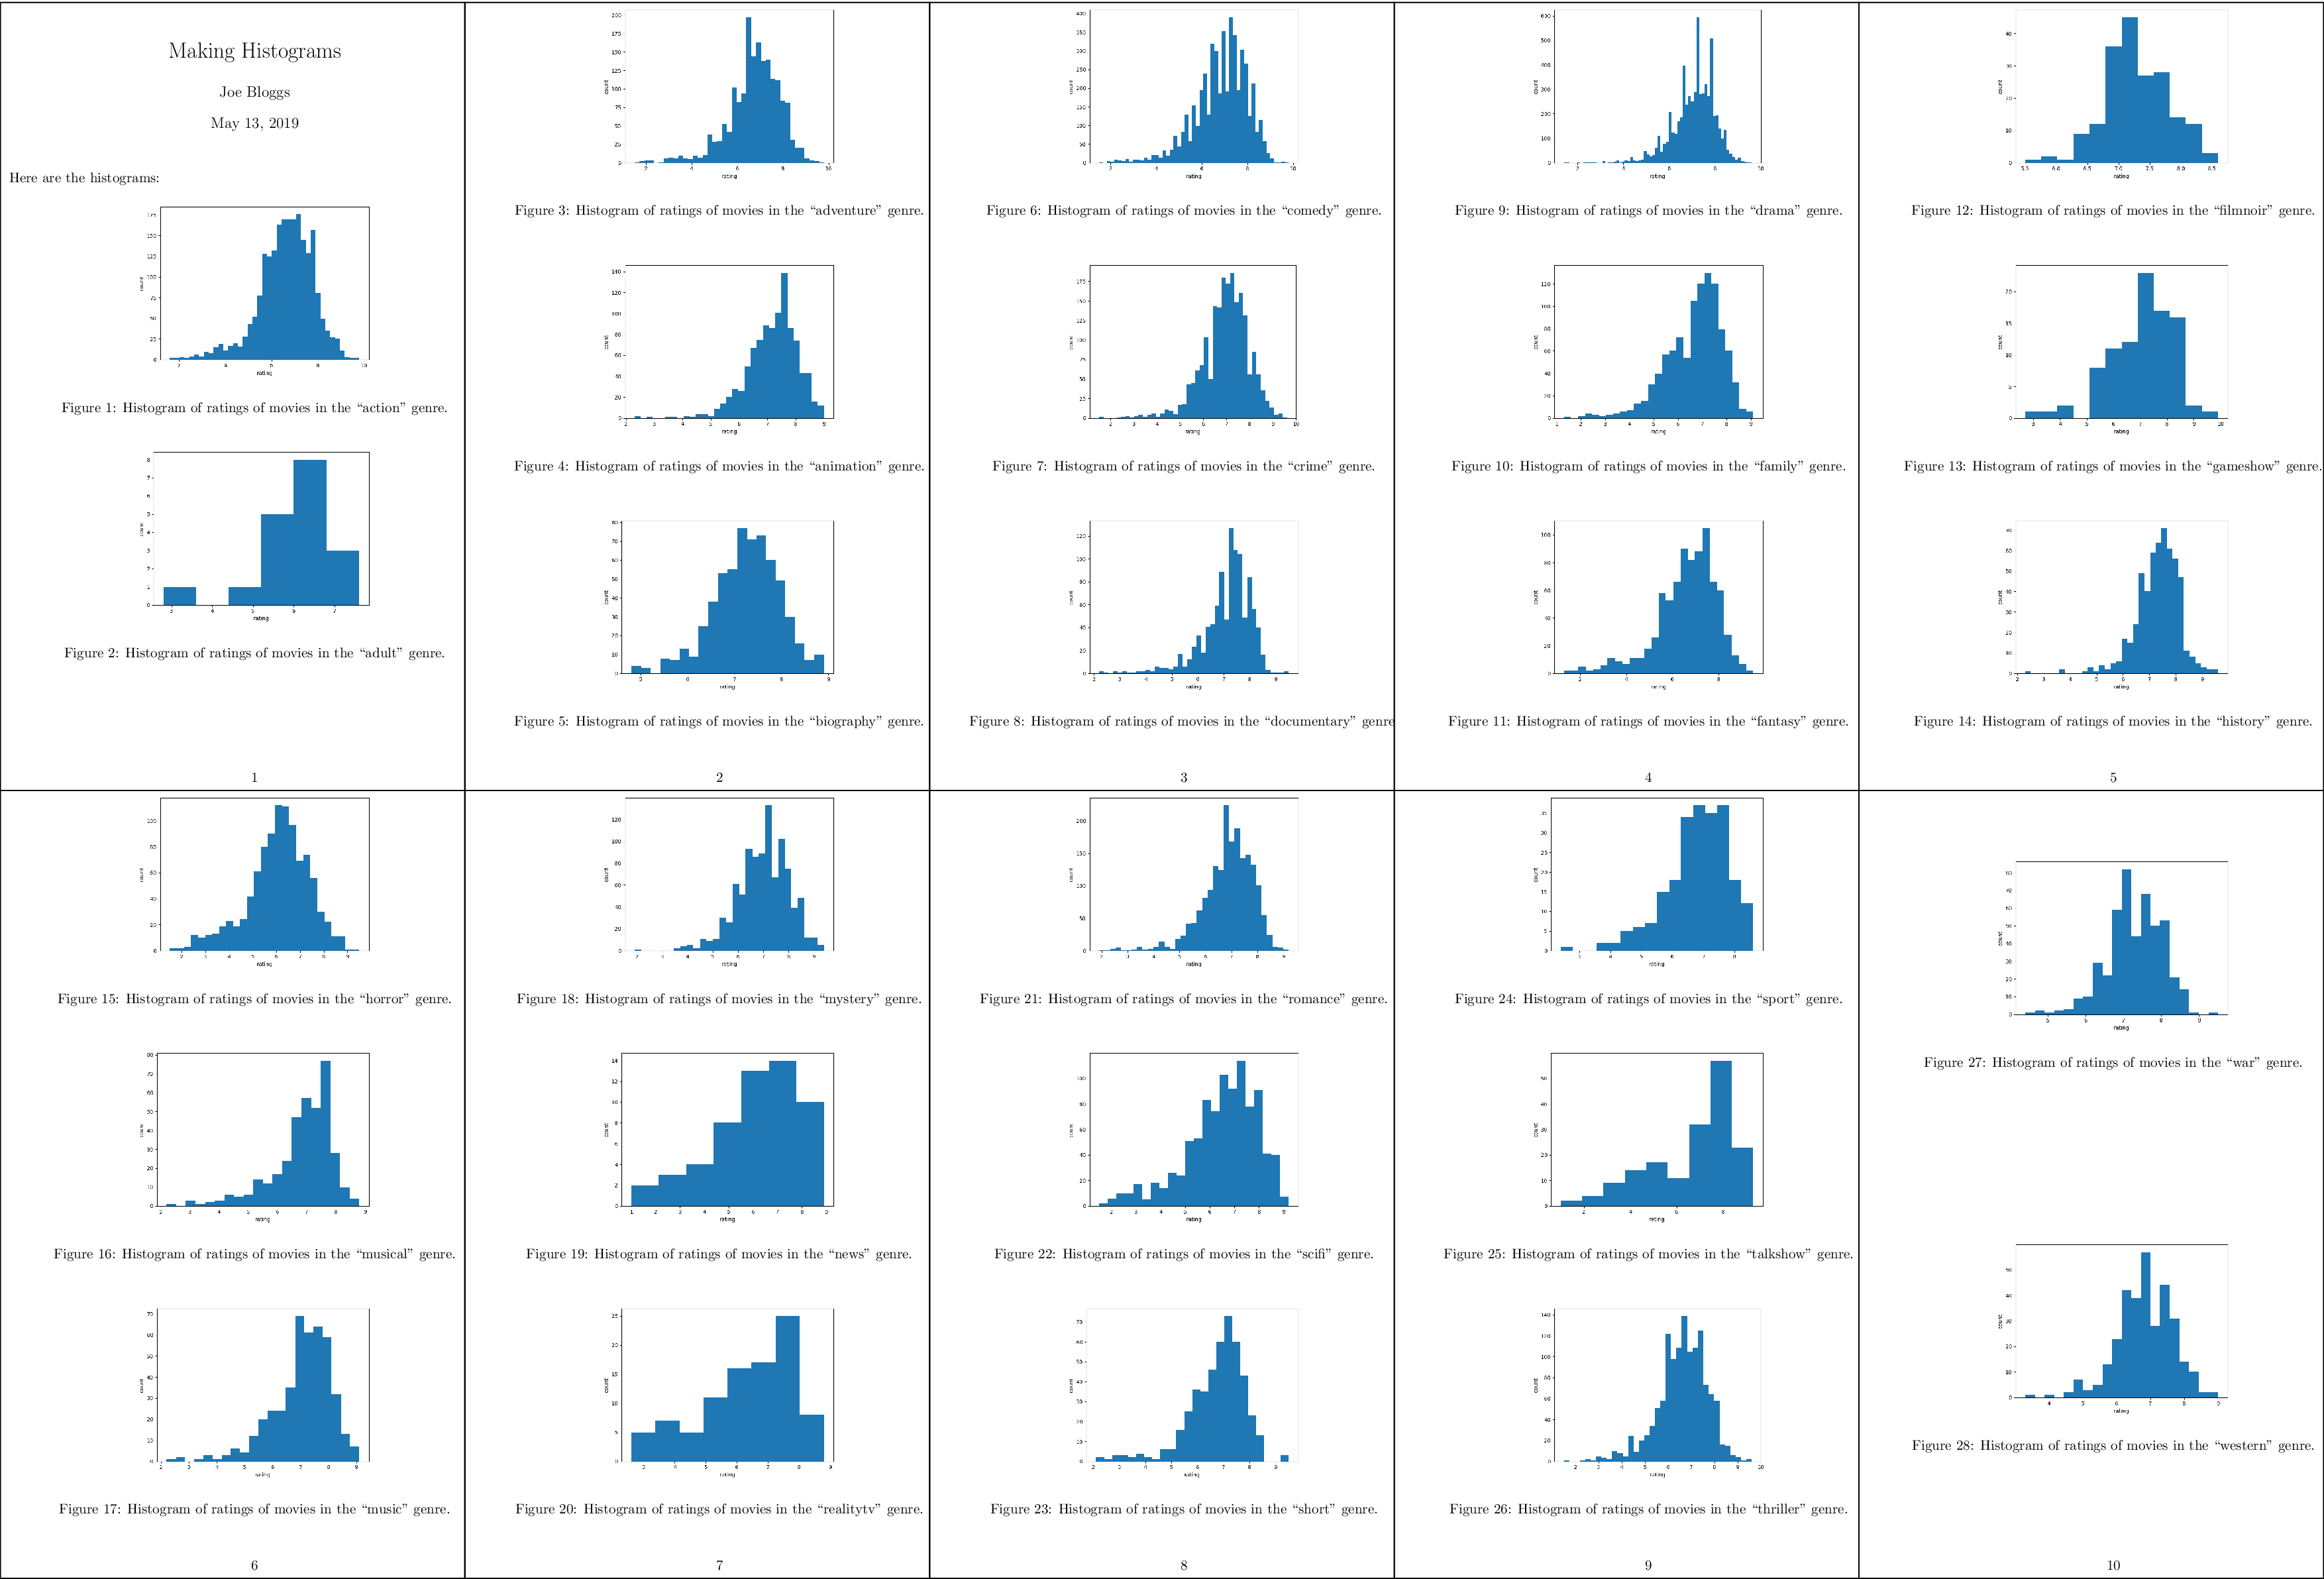 A compressed
view of the report with histograms for all genres.
A compressed
view of the report with histograms for all genres.